Note
Go to the end to download the full example code.
Low-resolution volume alignment of 2 individuals with fMRI data#
In this example, we align 2 low-resolution brain volumes using 4 fMRI feature maps (z-score contrast maps).
import numpy as np
import matplotlib.colors as colors
import matplotlib.pyplot as plt

from mpl_toolkits.axes_grid1 import make_axes_locatable
from nilearn import datasets, image
from scipy.spatial import distance_matrix

from fugw.mappings import FUGW
We first fetch 5 contrasts for each subject from the localizer dataset.
n_subjects = 2

contrasts = [
    "sentence reading vs checkerboard",
    "sentence listening",
    "calculation vs sentences",
    "left vs right button press",
    "checkerboard",
]
n_training_contrasts = 4

brain_data = datasets.fetch_localizer_contrasts(
    contrasts,
    n_subjects=n_subjects,
    get_anats=True,
)

source_imgs_paths = brain_data["cmaps"][0 : len(contrasts)]
target_imgs_paths = brain_data["cmaps"][len(contrasts) : 2 * len(contrasts)]

source_im = image.load_img(source_imgs_paths)
target_im = image.load_img(target_imgs_paths)
We greatly downsample all image to reduce the computational cost so that this example will run on a CPU.
SCALE_FACTOR = 5

source_maps = np.nan_to_num(
    source_im.get_fdata()[::SCALE_FACTOR, ::SCALE_FACTOR, ::SCALE_FACTOR]
)
target_maps = np.nan_to_num(
    target_im.get_fdata()[::SCALE_FACTOR, ::SCALE_FACTOR, ::SCALE_FACTOR]
)

segmentation_fine = np.logical_not(np.isnan(source_im.get_fdata()[:, :, :, 0]))
segmentation_coarse = segmentation_fine[
    ::SCALE_FACTOR, ::SCALE_FACTOR, ::SCALE_FACTOR
]
coordinates = np.array(np.nonzero(segmentation_coarse)).T
fig = plt.figure(figsize=(5, 5))

ax = fig.add_subplot(projection="3d")
ax.set_title("Anatomical coordinates of voxels")
ax.scatter(coordinates[:, 0], coordinates[:, 1], coordinates[:, 2], marker="o")

ax.view_init(10, 135)
ax.set_axis_off()
plt.show()
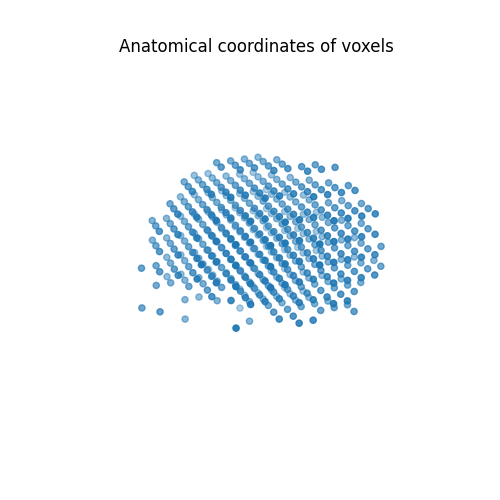
Eventually, we extract the features at each voxel and end up with roughly 500 voxels.
source_features = source_maps[
    coordinates[:, 0], coordinates[:, 1], coordinates[:, 2]
].T
target_features = target_maps[
    coordinates[:, 0], coordinates[:, 1], coordinates[:, 2]
].T
source_features.shape
(5, 484)
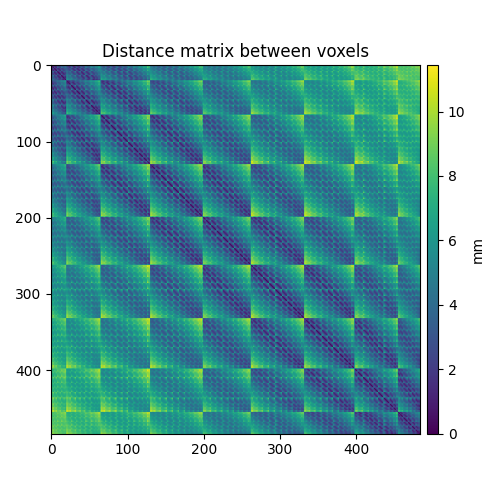
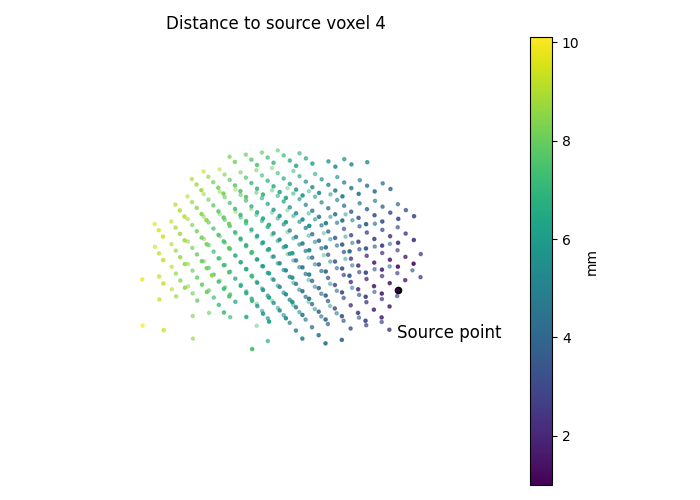
We then compute the distance matrix between voxel coordinates.
source_geometry = distance_matrix(coordinates, coordinates)
target_geometry = source_geometry.copy()

fig = plt.figure(figsize=(5, 5))

ax = fig.add_subplot(111)
ax.set_title("Distance matrix between voxels")
im = ax.imshow(source_geometry)

divider = make_axes_locatable(ax)
cax = divider.append_axes("right", size="3%", pad="2%")
fig.colorbar(im, cax=cax, label="mm")

plt.tight_layout()
plt.show()
vertex_index = 4
fig = plt.figure(figsize=(7, 5))

ax = fig.add_subplot(111, projection="3d")
ax.set_title(f"Distance to source voxel {vertex_index}")

# Plot brain geometry
im = ax.scatter(
    coordinates[1:, 0],
    coordinates[1:, 1],
    coordinates[1:, 2],
    marker=".",
    c=source_geometry[0, 1:],
)

# Add source point label
ax.scatter(
    coordinates[vertex_index, 0],
    coordinates[vertex_index, 1],
    coordinates[vertex_index, 2],
    marker="o",
    c="black",
)
ax.text(
    coordinates[vertex_index, 0],
    coordinates[vertex_index, 1],
    coordinates[vertex_index, 2] - 2,
    "Source point",
    size=12,
    color="black",
)

# Add colorbar
colorbar = fig.colorbar(
    im,
    ax=ax,
    label="mm",
)
colorbar.ax.set_position([0.9, 0.15, 0.03, 0.7])

ax.view_init(10, 135)
ax.set_axis_off()

plt.tight_layout()
plt.show()
In order to avoid numerical errors when fitting the mapping, we normalize both the features and the geometry.
source_features_normalized = source_features / np.linalg.norm(
    source_features, axis=1
).reshape(-1, 1)
target_features_normalized = target_features / np.linalg.norm(
    target_features, axis=1
).reshape(-1, 1)
source_geometry_normalized = source_geometry / np.max(source_geometry)
target_geometry_normalized = target_geometry / np.max(target_geometry)
We now fit the mapping using the sinkhorn solver and 3 BCD iterations.
mapping = FUGW(alpha=0.5, rho=1, eps=1e-4)
_ = mapping.fit(
    source_features_normalized[:n_training_contrasts],
    target_features_normalized[:n_training_contrasts],
    source_geometry=source_geometry_normalized,
    target_geometry=target_geometry_normalized,
    solver="sinkhorn",
    solver_params={
        "nits_bcd": 4,
    },
    verbose=True,
)
[14:37:01] Validation data for feature maps is not provided. Using  dense.py:199
           training data instead.
           Validation data for anatomical kernels is not provided.  dense.py:226
           Using training data instead.


[14:37:07] BCD step 1/4    FUGW loss:      0.025816654786467552     dense.py:568
           Validation loss:        0.025816654786467552


[14:37:17] BCD step 2/4    FUGW loss:      0.009248202666640282     dense.py:568
           Validation loss:        0.009248202666640282


[14:37:26] BCD step 3/4    FUGW loss:      0.007908511906862259     dense.py:568
           Validation loss:        0.007908511906862259


[14:37:35] BCD step 4/4    FUGW loss:      0.007553447037935257     dense.py:568
           Validation loss:        0.007553447037935257
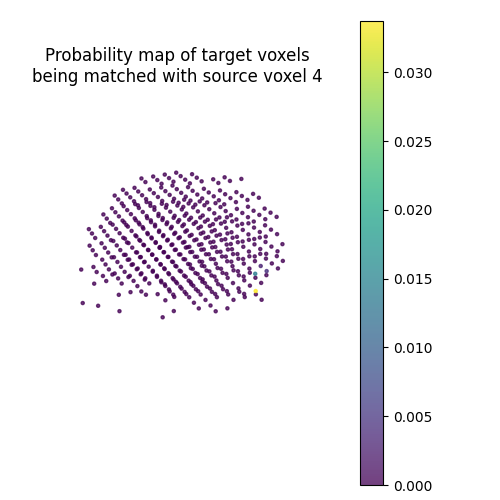
Let’s plot the probability map of target voxels being matched with the 4th source voxel.
pi = mapping.pi
probability_map = pi[vertex_index, :] / np.sqrt(
    np.linalg.norm(pi[vertex_index, :])
)

fig = plt.figure(figsize=(5, 5))

ax = fig.add_subplot(projection="3d")
ax.set_title(
    "Probability map of target voxels\n"
    f"being matched with source voxel {vertex_index}"
)

s = ax.scatter(
    coordinates[:, 0],
    coordinates[:, 1],
    coordinates[:, 2],
    marker=".",
    c=probability_map,
    cmap="viridis",
    alpha=0.75,
)

colorbar = fig.colorbar(s, ax=ax)
colorbar.ax.set_position([0.9, 0.15, 0.03, 0.7])

ax.view_init(10, 135, 2)
ax.set_axis_off()
plt.tight_layout()
plt.show()
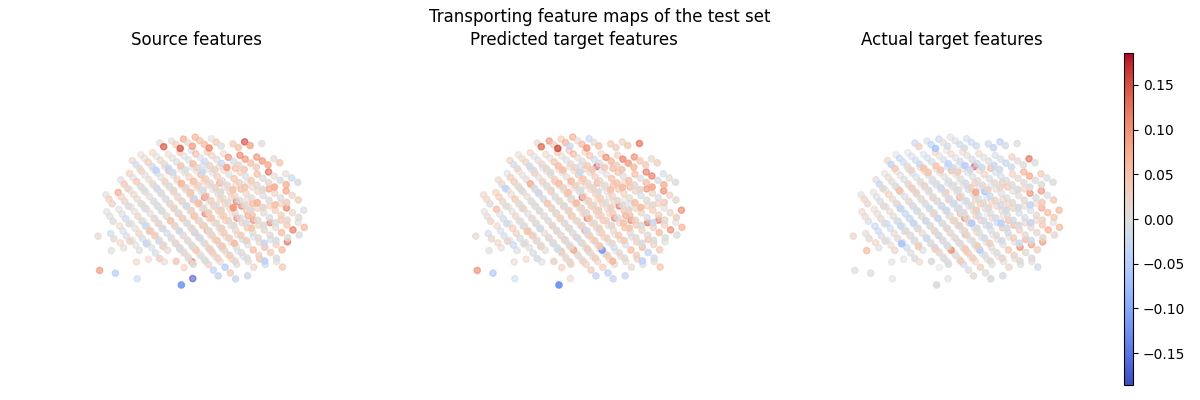
We can now align test contrasts using the fitted mapping.
contrast_index = -1
predicted_target_features = mapping.transform(
    source_features[contrast_index, :]
)
predicted_target_features.shape
(484,)
Let’s compare the Pearson correlation between source and target features.
corr_pre_mapping = np.corrcoef(
    source_features[contrast_index, :], target_features[contrast_index, :]
)[0, 1]
corr_post_mapping = np.corrcoef(
    predicted_target_features, target_features[contrast_index, :]
)[0, 1]
print(f"Pearson Correlation pre-mapping: {corr_pre_mapping:.2f}")
print(f"Pearson Correlation post-mapping: {corr_post_mapping:.2f}")
print(
    "Relative improvement:"
    f" {(corr_post_mapping - corr_pre_mapping) / corr_pre_mapping * 100 :.2f}"
    " %"
)
Pearson Correlation pre-mapping: 0.28
Pearson Correlation post-mapping: 0.37
Relative improvement: 30.13 %
Let’s plot the transporting feature maps of the test set.
fig = plt.figure(figsize=(12, 4))

fig.suptitle("Transporting feature maps of the test set")

ax = fig.add_subplot(1, 3, 1, projection="3d")
s = ax.scatter(
    coordinates[:, 0],
    coordinates[:, 1],
    coordinates[:, 2],
    marker="o",
    c=source_features_normalized[-1, :],
    cmap="coolwarm",
    norm=colors.CenteredNorm(),
)

ax.view_init(10, 135, 2)
ax.set_title("Source features")
ax.set_axis_off()

ax = fig.add_subplot(1, 3, 2, projection="3d")
ax.scatter(
    coordinates[:, 0],
    coordinates[:, 1],
    coordinates[:, 2],
    marker="o",
    c=predicted_target_features,
    cmap="coolwarm",
    norm=colors.CenteredNorm(),
)

ax.view_init(10, 135, 2)
ax.set_title("Predicted target features")
ax.set_axis_off()

ax = fig.add_subplot(1, 3, 3, projection="3d")
ax.scatter(
    coordinates[:, 0],
    coordinates[:, 1],
    coordinates[:, 2],
    marker="o",
    c=target_features_normalized[-1, :],
    cmap="coolwarm",
    norm=colors.CenteredNorm(),
)

ax.view_init(10, 135, 2)
ax.set_title("Actual target features")
ax.set_axis_off()

ax = fig.add_subplot(1, 1, 1)
ax.set_axis_off()
divider = make_axes_locatable(ax)
cax = divider.append_axes("right", size="1%")
fig.colorbar(s, cax=cax)

plt.tight_layout()
plt.show()
Total running time of the script: (0 minutes 38.479 seconds)
Estimated memory usage: 65 MB