Note
Go to the end to download the full example code.
Using a validation set to monitor the convergence of the fugw loss#
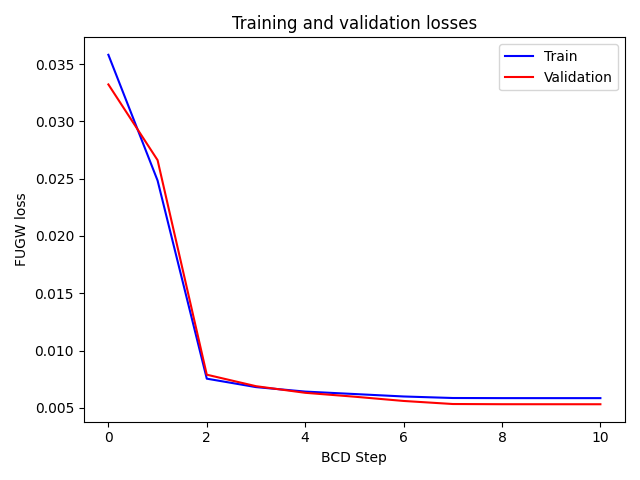
In this example, we use 3 fMRI feature maps for training and 2 independant fMRI feature maps for testing to examine the evolutions of a training and a validation loss on 2 low-resolution brain volumes.
import numpy as np
import matplotlib.pyplot as plt

from nilearn import datasets, image, plotting
from scipy.spatial import distance_matrix
from fugw.mappings import FUGW
We first fetch 5 contrasts for each subject from the localizer dataset.
n_subjects = 2

contrasts = [
    "sentence reading vs checkerboard",
    "sentence listening",
    "calculation vs sentences",
    "left vs right button press",
    "checkerboard",
]
n_training_contrasts = 3

brain_data = datasets.fetch_localizer_contrasts(
    contrasts,
    n_subjects=n_subjects,
    get_anats=True,
    get_masks=True,
)

source_imgs_paths = brain_data["cmaps"][0 : len(contrasts)]
target_imgs_paths = brain_data["cmaps"][len(contrasts) : 2 * len(contrasts)]
source_mask = brain_data["masks"][0]

source_im = image.load_img(source_imgs_paths)
target_im = image.load_img(target_imgs_paths)
mask = image.load_img(source_mask)
We then downsample the images by 5 to reduce the computational cost.
SCALE_FACTOR = 5

resized_source_affine = source_im.affine.copy() * SCALE_FACTOR
resized_target_affine = target_im.affine.copy() * SCALE_FACTOR

source_im_resized = image.resample_img(source_im, resized_source_affine)
target_im_resized = image.resample_img(target_im, resized_target_affine)
mask_resized = image.resample_img(mask, resized_source_affine)

source_maps = np.nan_to_num(source_im_resized.get_fdata())
target_maps = np.nan_to_num(target_im_resized.get_fdata())
segmentation = mask_resized.get_fdata()

coordinates = np.argwhere(segmentation > 0)

source_features = source_maps[
    coordinates[:, 0], coordinates[:, 1], coordinates[:, 2]
].T
target_features = target_maps[
    coordinates[:, 0], coordinates[:, 1], coordinates[:, 2]
].T

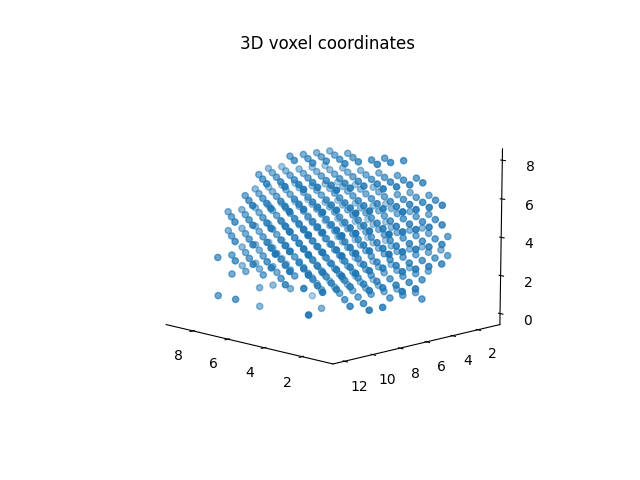
fig = plt.figure()
ax = fig.add_subplot(projection="3d")
ax.scatter(coordinates[:, 0], coordinates[:, 1], coordinates[:, 2], marker="o")
ax.view_init(10, 135)
# make the panes transparent
ax.xaxis.set_pane_color((1.0, 1.0, 1.0, 0.0))
ax.yaxis.set_pane_color((1.0, 1.0, 1.0, 0.0))
ax.zaxis.set_pane_color((1.0, 1.0, 1.0, 0.0))
# make the grid lines transparent
ax.xaxis._axinfo["grid"]["color"] = (1, 1, 1, 0)
ax.yaxis._axinfo["grid"]["color"] = (1, 1, 1, 0)
ax.zaxis._axinfo["grid"]["color"] = (1, 1, 1, 0)
ax.set_title("3D voxel coordinates")
plt.show()

/usr/local/lib/python3.8/site-packages/nilearn/image/resampling.py:664: RuntimeWarning:

NaNs or infinite values are present in the data passed to resample. This is a bad thing as they make resampling ill-defined and much slower.

/usr/local/lib/python3.8/site-packages/nilearn/image/resampling.py:664: RuntimeWarning:

NaNs or infinite values are present in the data passed to resample. This is a bad thing as they make resampling ill-defined and much slower.

/usr/local/lib/python3.8/site-packages/nilearn/image/resampling.py:664: RuntimeWarning:

NaNs or infinite values are present in the data passed to resample. This is a bad thing as they make resampling ill-defined and much slower.

/usr/local/lib/python3.8/site-packages/nilearn/image/resampling.py:664: RuntimeWarning:

NaNs or infinite values are present in the data passed to resample. This is a bad thing as they make resampling ill-defined and much slower.

/usr/local/lib/python3.8/site-packages/nilearn/image/resampling.py:664: RuntimeWarning:

NaNs or infinite values are present in the data passed to resample. This is a bad thing as they make resampling ill-defined and much slower.

/usr/local/lib/python3.8/site-packages/nilearn/image/resampling.py:664: RuntimeWarning:

NaNs or infinite values are present in the data passed to resample. This is a bad thing as they make resampling ill-defined and much slower.

/usr/local/lib/python3.8/site-packages/nilearn/image/resampling.py:664: RuntimeWarning:

NaNs or infinite values are present in the data passed to resample. This is a bad thing as they make resampling ill-defined and much slower.

/usr/local/lib/python3.8/site-packages/nilearn/image/resampling.py:664: RuntimeWarning:

NaNs or infinite values are present in the data passed to resample. This is a bad thing as they make resampling ill-defined and much slower.

/usr/local/lib/python3.8/site-packages/nilearn/image/resampling.py:664: RuntimeWarning:

NaNs or infinite values are present in the data passed to resample. This is a bad thing as they make resampling ill-defined and much slower.

/usr/local/lib/python3.8/site-packages/nilearn/image/resampling.py:664: RuntimeWarning:

NaNs or infinite values are present in the data passed to resample. This is a bad thing as they make resampling ill-defined and much slower.

/usr/local/lib/python3.8/site-packages/nilearn/image/resampling.py:293: UserWarning:

Resampling binary images with continuous or linear interpolation. This might lead to unexpected results. You might consider using nearest interpolation instead.
We then compute the distance matrix between voxel coordinates.
source_geometry = distance_matrix(coordinates, coordinates)
target_geometry = source_geometry.copy()
In order to avoid numerical errors when fitting the mapping, we normalize both the features and the geometry.
source_features_normalized = source_features / np.linalg.norm(
    source_features, axis=1
).reshape(-1, 1)
target_features_normalized = target_features / np.linalg.norm(
    target_features, axis=1
).reshape(-1, 1)
source_geometry_normalized = source_geometry / np.max(source_geometry)
target_geometry_normalized = target_geometry / np.max(target_geometry)
We now fit the mapping using the sinkhorn solver and 10 BCD iterations. We use the first 3 feature maps for training and the last 2 for validation. Anatomical kernels are kept identical for both training and validation, as it will usually be the case in practice when aligning real fMRI data.
mapping = FUGW(alpha=0.5, rho=1, eps=1e-4)
_ = mapping.fit(
    source_features=source_features_normalized[:n_training_contrasts],
    target_features=target_features_normalized[:n_training_contrasts],
    source_geometry=source_geometry_normalized,
    target_geometry=target_geometry_normalized,
    source_features_val=source_features_normalized[n_training_contrasts:],
    target_features_val=target_features_normalized[n_training_contrasts:],
    solver="sinkhorn",
    solver_params={
        "nits_bcd": 10,
    },
    verbose=True,
)
[14:40:32] Validation data for anatomical kernels is not provided.  dense.py:226
           Using training data instead.


[14:40:37] BCD step 1/10   FUGW loss:      0.024832360446453094     dense.py:568
           Validation loss:        0.02661185897886753


[14:40:47] BCD step 2/10   FUGW loss:      0.0075426651164889336    dense.py:568
           Validation loss:        0.007890073582530022


[14:40:56] BCD step 3/10   FUGW loss:      0.006806435063481331     dense.py:568
           Validation loss:        0.006886775605380535


[14:41:05] BCD step 4/10   FUGW loss:      0.006414878182113171     dense.py:568
           Validation loss:        0.00630957493558526


[14:41:14] BCD step 5/10   FUGW loss:      0.006202980875968933     dense.py:568
           Validation loss:        0.005970312282443047


[14:41:23] BCD step 6/10   FUGW loss:      0.005988470744341612     dense.py:568
           Validation loss:        0.005597750190645456


[14:41:32] BCD step 7/10   FUGW loss:      0.005855489056557417     dense.py:568
           Validation loss:        0.005330917425453663


[14:41:41] BCD step 8/10   FUGW loss:      0.005845479667186737     dense.py:568
           Validation loss:        0.005313139874488115


[14:41:50] BCD step 9/10   FUGW loss:      0.005844404920935631     dense.py:568
           Validation loss:        0.0053114378824830055


[14:42:00] BCD step 10/10  FUGW loss:      0.005843969993293285     dense.py:568
           Validation loss:        0.005310213193297386
Plot the evolution of losses on train and test datasets.
fig, ax1 = plt.subplots()
ax1.set_xlabel("BCD Step")
ax1.set_ylabel("FUGW loss", color="black")
ax1.tick_params(axis="y", labelcolor="black")

ax1.plot(mapping.loss_steps, mapping.loss["total"], color="blue")
ax1.plot(mapping.loss_steps, mapping.loss_val["total"], color="red")

plt.title("Training and validation losses")
plt.legend(["Train", "Validation"])
fig.tight_layout()  # otherwise the right y-label is slightly clipped
plt.show()

Plot the alignment of the second validation feature map and project it on the fsaverage5 surface.
example_array = np.nan_to_num(source_im_resized.slicer[..., -1].get_fdata())
example_array /= np.max(np.abs(example_array))
example = image.new_img_like(source_im_resized, example_array)
plotting.view_img_on_surf(example, threshold="50%", surf_mesh="fsaverage5")
Total running time of the script: (1 minutes 30.430 seconds)
Estimated memory usage: 65 MB